Mobile Advertising Hits Landmark $49.9 Billion, While Digital Video Climbs to a Record $11.9 Billion, According to 2017 IAB Internet Advertising Revenue Report
NEW YORK, NY (May 10, 2018) —Total U.S. digital ad spend reached a record-setting $88 billion last year, according to the latest IAB Internet Advertising Revenue Report, released today by the Interactive Advertising Bureau (IAB), and prepared by PwC US. This represents a 21 percent uptick over the previous year at $72.5 billion, and marks the first time in this report that digital ad revenues have overtaken television (broadcast and cable combined).
Mobile built on its momentum from 2016, when it first took more than half of total revenues—claiming an even bigger slice of the pie in 2017 at 57 percent. Spend on mobile rose from $36.6 billion in 2016 to $49.9 billion in 2017, marking a 36 percent increase year-over-year.
Other highlights from the report include:
- Digital video hit a record $11.9 billion in 2017, a 33 percent year-over-year increase from $8.9 billion in 2016
- On mobile devices, video revenue surged by 54 percent to $6.2 billion, representing the first time that mobile video revenues have surpassed desktop video
- Social media advertising commanded $22.2 billion last year, rising 36 percent over $16.3 billion in 2016
- Search revenues reached nearly $40.6 billion in 2017, up 18 percent from $34.6 billion in 2016
- Banner advertising is up 23 percent to $27.5 billion, 67 percent of which is derived from mobile banners.
- Digital audio, measured for the second time in a full-year report, is up 39 percent to $1.6 billion from $1.1 billion in 2016
“Consumers are increasingly spending a tremendous amount of time with interactive screens and content – from mobile to desktop and audio to OTT – and brands are in lockstep with a growing commitment to digital ad buys,” said Randall Rothenberg, CEO, IAB. “Mobile captured more than half of the total digital ad spend last year and we can easily expect that share to continue to climb. Video also saw significant growth. That is no surprise—especially after seeing buyers clamoring to get into last week’s NewFronts presentations in New York.”
“Smartphones and tablets have become indispensable tools in the hands of consumers, from the moment they wake up to right before they go to sleep,” said Anna Bager, Executive Vice President, Industry Initiatives, IAB. “A double digit uptick in spend on mobile video is testament to both the pull of mobile and consumer’s never-ending demand for sight, sound, and motion—even while on-the-go. In addition, brands are embracing digital audio at a fast clip, recognizing the power of this burgeoning medium.”
“Digital advertising revenues have been steadily rising for several years and buyers continue to increase their investment,” said David Silverman, Partner, PwC US. “From mobile to video, consumers are constantly turning to digital, whether for information, entertainment, shopping, sharing, or more.”
IAB Full Year Report- Comparison of 2017 and 2016 Data (in millions)
| Revenue (Ad Forms) | Full Year 2016 | Full Year 2017 | ||
| % | $ | % | $ | |
| Search (Mobile and Desktop) | 47.7% | $34,575 | 46.2% | $40,630 |
| Banner (Mobile and Desktop) | 30.7% | $22,288 | 31.2% | $27,491 |
| Sponsorships | 1.0% | $722 | 0.9% | $824 |
| Rich Media | 2.8% | $2,011 | 2.9% | $2,509 |
| Ad banners / display ads | 27.0% | $19,554 | 27.4% | $24,158 |
| Digital Video Commercials (Mobile and Desktop) | 12.3% | $8,926 | 13.5% | $11,863 |
| Other (Mobile and Desktop) | 9.3% | $6,732 | 9.1% | $8,023 |
| Classifieds and Directories | 4.2% | $3,018 | 3.8% | $3,354 |
| Lead Generation | 3.4% | $2,497 | 3.4% | $2,953 |
| Audio | 1.6% | $1,130 | 1.8% | $1,574 |
| Other (Mobile Other) | 0.1% | $86 | 0.2% | $142 |
| Total | 100% | $72,521 | 100% | $88,007 |
| Revenue (Desktop v Mobile) | Full Year 2016 | Full Year 2017 | ||
| % | $ | % | $ | |
| Desktop | 49.5% | $35,881 | 43.3% | $38,105 |
| Mobile | 50.5% | $36,641 | 56.7% | $49,902 |
| Total | 100% | $72,521 | 100% | $88,007 |
| Revenue (Pricing Models) | Full Year 2016 | Full Year 2017 | ||
| % | $ | % | $ | |
| Search (Mobile and Desktop) | 34.6% | $25,085 | 33.9% | $29,794 |
| Banner (Mobile and Desktop) | 64.0% | $46,432 | 62.3% | $54,813 |
| Hybrid | 1.4% | $1,004 | 3.9% | $3,400 |
| Total | 100% | $72,521 | 100% | $88,007 |
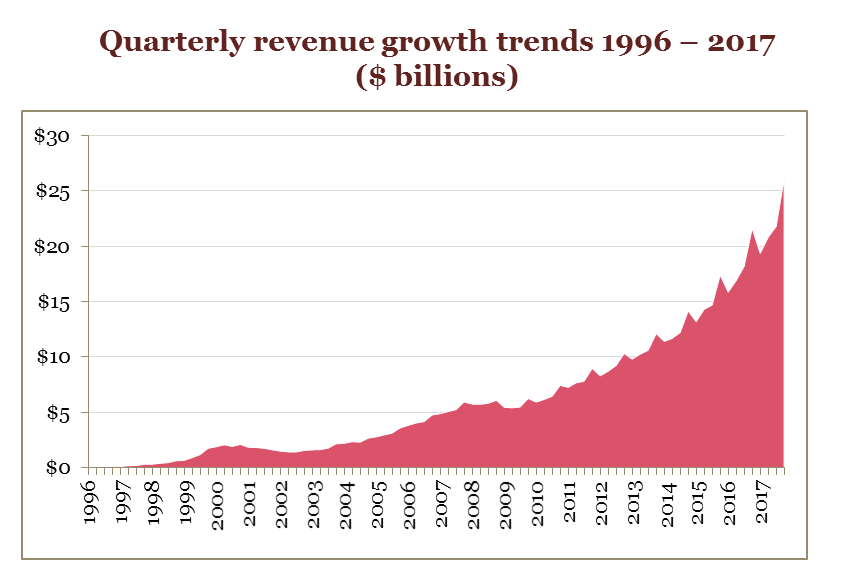
The following chart highlights quarterly ad revenue since IAB began measuring it in 1996; dollar figures are rounded.
IAB sponsors the IAB Internet Advertising Revenue Report, which is conducted independently by the New Media Group of PwC. The Q4 2017 revenue is estimated based upon a representative sample of the overall survey respondents. The results are considered a reasonable measurement of interactive advertising revenues because the data is compiled directly from information supplied by companies selling advertising on the internet. The survey includes data concerning online advertising revenues from web sites, commercial online services, free email providers, and all other companies selling online advertising.
The full report is issued twice yearly for full and half-year data, and top-line quarterly estimates are issued for the first and third quarters. PwC does not audit the information and provides no opinion or other form of assurance with respect to the information. Past reports are available at iab.com/adrevenuereport.
About PwC US
At PwC, our purpose is to build trust in society and solve important problems. We’re a network of firms in 158 countries with more than 236,000 people who are committed to delivering quality in assurance, advisory and tax services. Find out more and tell us what matters to you by visiting us at www.pwc.com.
©2018 PwC. All rights reserved. PwC refers to the PwC network and/or one or more of its member firms, each of which is a separate legal entity. Please see www.pwc.com/structure for further details.
About IAB
The Interactive Advertising Bureau (IAB) empowers the media and marketing industries to thrive in the digital economy. Its membership is comprised of more than 650 leading media and technology companies that are responsible for selling, delivering, and optimizing digital advertising or marketing campaigns. The trade group fields critical research on interactive advertising, while also educating brands, agencies, and the wider business community on the importance of digital marketing. In affiliation with the IAB Tech Lab, it develops technical standards and best practices. IAB is committed to professional development and elevating the knowledge, skills, expertise, and collaboration of the workforce across the industry. Through the work of its public policy office in Washington, D.C., IAB advocates for its members and promotes the value of the interactive advertising industry to legislators and policymakers. Founded in 1996, the IAB is headquartered in New York City and has a San Francisco office.
IAB Media Contact
Laura Goldberg
347.683.1859
[email protected]
PwC Media Contact
Carey Bodenheimer
213.392.9684
[email protected]